The landscapes of Indian Residential Schools contain cemeteries, and some of the children who died at these institutions were buried in these places or in cemeteries beyond the IRS grounds. In many cases these children are missing - their locations are not known to their families or communities and they may be in unmarked graves. GPR can assist in locating these burials. We also know that some IRS landscapes contain informal cemeteries - places used for burial but which are not registered or maintained as cemeteries. We also know of clandestine burials, places where the graves were located in isolation in places not otherwise used as cemeteries.
Ground-penetrating Radar (GPR) has been very successful at locating burials, including unmarked burials, for decades. GPR also has an excellent track record of locating near-surface buried features including geological patterns and things created by humans both from recent activity (e.g. in industry) and in the past (e.g. archaeology). GPR works best for finding large (+0.5 m), spatially organized (e.g. linear), human-made (anthropogenic) patterns when the matrix (surrounding geological sediment) is not highly reflective of the GPR signal and the target (architecture, burial, etc.) is reflective; the reverse is also true but much rarer. In these kinds of contexts, the interpretation of GPR results is fairly straightforward.
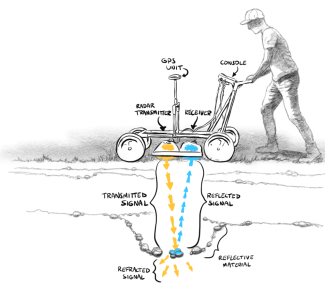
For example, GPR is routinely used by geo-technicians to locate service trenches containing water, gas, electrical, etc., lines. Such trenches are usually about 0.5 m wide and 0.5 m to 1 m deep and run in relatively straight lines in predictable patterns from supply sources to supply points. Trenches usually occur within stable areas of small to medium (clay to gravel) sized sediments, such as construction pre-load fill. In this case, The service trench is reflective because of 1) its contents (pipes, etc.) and 2) the disturbed sediments of the trench which attract water relative to the matrix. As discussed below, these traits along with the shape of the trench make it a visible result in GPR scans against the background.

Illustration by Eric Simons. This work is licensed under a Creative Commons Attribution-NonCommercial-NoDerivatives 4.0 International License
What Creates Results in GPR?
GPR results appear as visualized patterns of reflected electromagnetic (EM) waves from patterns in the subsurface. Things that are nearby but not underground can also appear in results, but we'll review that separately. This relationship has some important parameters:
- The frequency of the EM signal is related to the depth it can penetrate and the smallest size of object that can be resolved. These are inversely related (opposites). Higher frequencies create results from smaller subsurface patterns but cannot go as deep. So: higher frequencies=shallower results=smaller objects and lower frequencies=deeper results=larger objects. In archaeology we usually use frequencies around 500 MHz that travel about 1-2 m into the ground and can be influenced by objects about 10-25 cm in size.
- The reflected signal is also EM waves that include qualities such as its strength, polarity, and location.
- The generated and reflected waves can interact creating characteristic patterns. These are especially important for human made patterns whihc have features such as vertical discontinuities and voids that are less common in nature. Geophysicists who study natural subsurface patterns often seek to minimize the influence of these wave interactions through filtering such as migration filters - sometimes erasing the very data of value in archaeology.
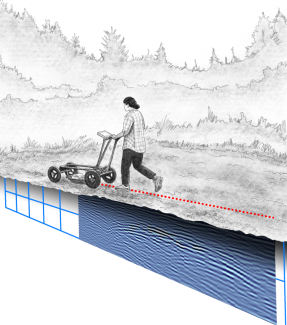
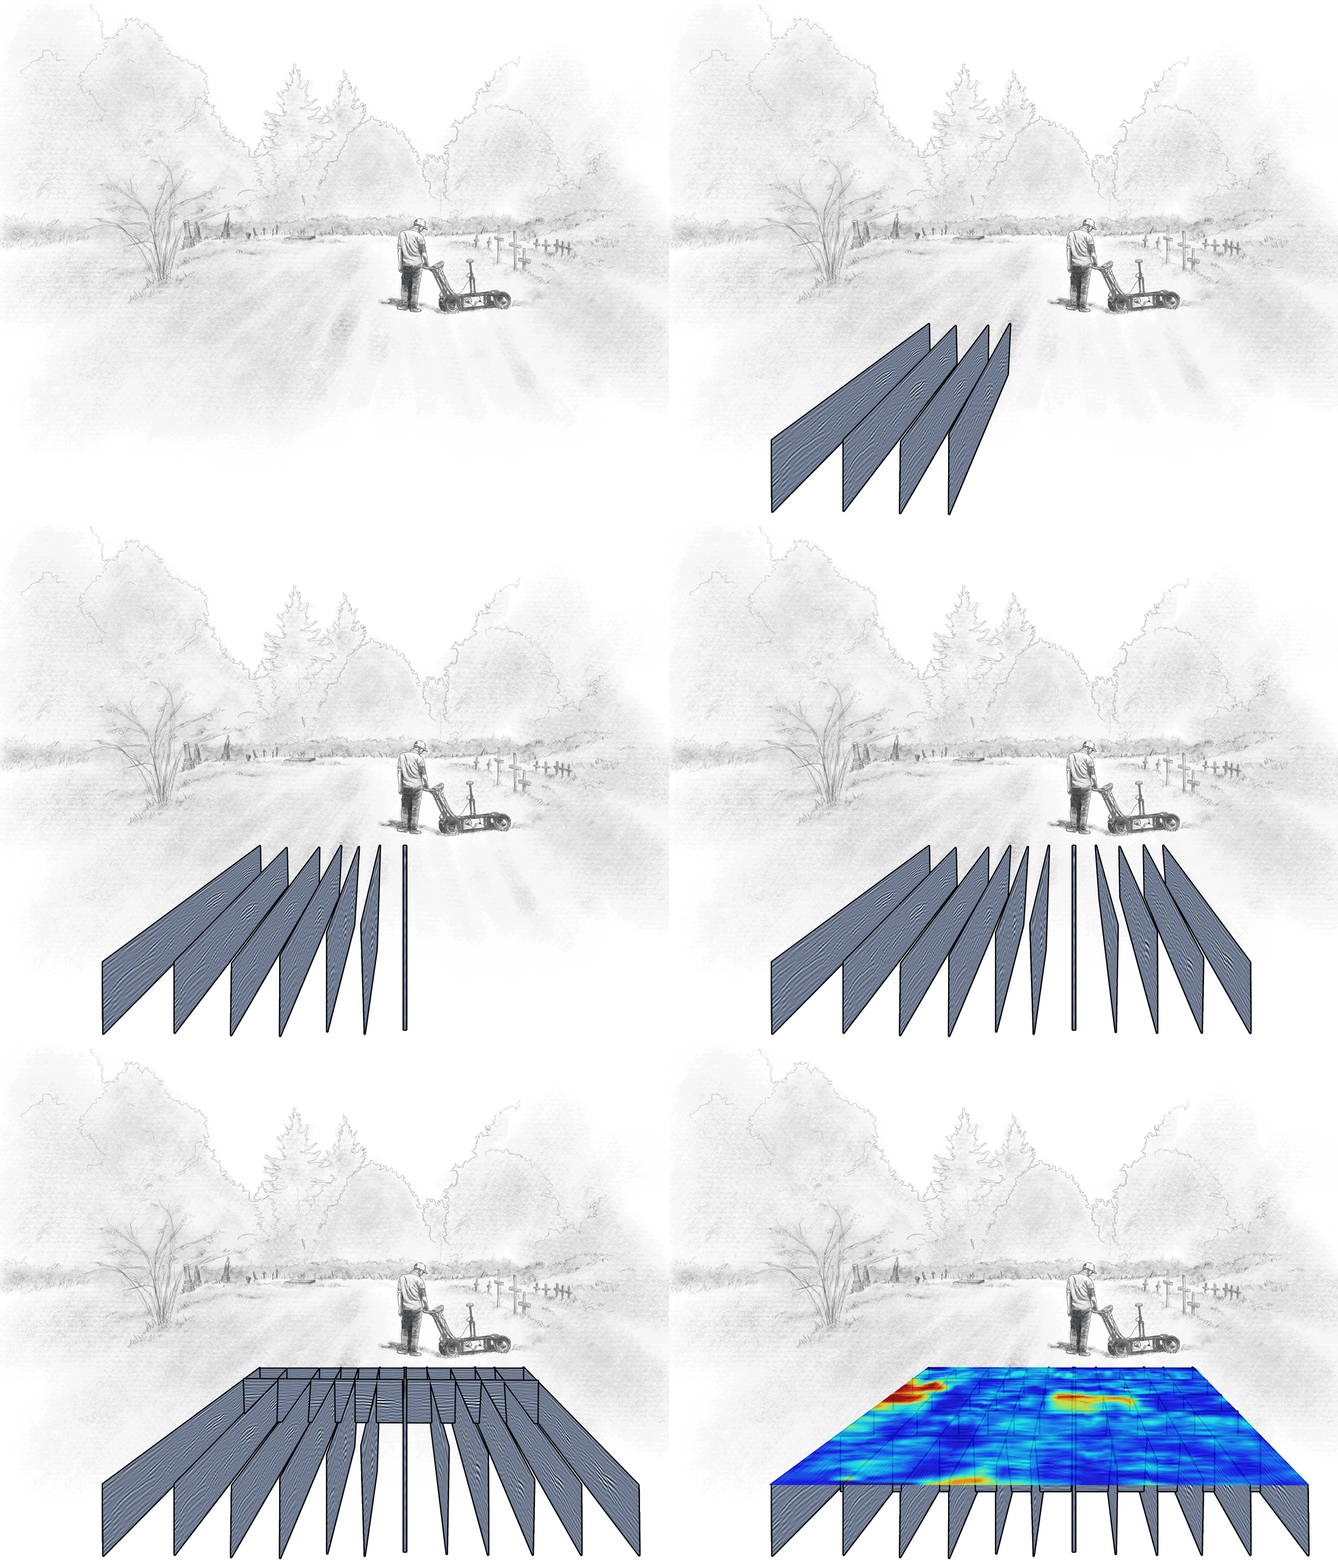
- GPR results are reflected EM waves that are collected as values (numbers) over time and by location of the GPR device. Operators cannot easily make sense of these number arrays, so GPR software converts them into pictures in plan view (from above: amplitude maps) and profiles (from the side: radargrams). The process of interpreting GPR results is the analysis of these visualized results.
- GPR EM waves are reflected back to the device to be recorded by two main processes both of which derive from the same physical principle. When the EM wave crosses a boundary between different materials with different EM properties, some of the signal passes through the boundary and some is reflected. GPR results essentially map the part of the reflected signal that returns to the GPR device's receiving antenna. Although it is the same process, we usually divide these reflections into two forms:
- Reflections: when the boundary separates highly different materials, the majority of the signal is reflected creating a strong return signal. Materials such as metal or some kinds of rock have this effect. The object is visible in the results, but the signal does not pass through the boundary very far and can obscure things beyond it. Round shapes create point target hyperbolae while flat shapes create ringing patterns.
- Refractions: when the boundary is between materials that are not highly different, then much less of the signal is reflected back. A common example in archaeology is the boundary between disturbed soil (such as from an excavation) and undisturbed soil. The disturbed soil attracts water though capillary action (wicking) and becomes wetter. Water is more resistant to EM waves than air and the boundary (shape) of the excavation (i.e., between wet/disturbed and dry/undisturbed reflects the EM wave.
The following images from Eric Simons illustrate radargrams and how amplitude maps are interpolated from grids of radargrams.

Illustration by Eric Simons. This work is licensed under a Creative Commons Attribution-NonCommercial-NoDerivatives 4.0 International License

Illustration by Eric Simons. This work is licensed under a Creative Commons Attribution-NonCommercial-NoDerivatives 4.0 International License
What Kinds of GPR Results are Associated with Graves?
Most historic cemeteries are located in areas where it is easy to dig a grave with hand tools (i.e. it is composed of small sized sediments and does not contain large roots, boulders, heavy clay deposits or bedrock). This geology is not highly reflective of GPR EM waves. Against this low-reflective matrix background, graves appear in GPR because they are more reflective. Two things contribute to this: 1) the act of digging a grave loosens the sediment making it more absorbent of water in the grave shaft - and an area of higher water concentration is reflective, and 2) the contents of burials can add to the signal reflection in many ways. The result is that graves usually stand out as areas of high reflection in cemeteries. This principle is true outside of cemeteries, though these are more complex contexts.
Graves in cemeteries are also visible in GPR because they usually appear in regular shapes (dimensions, shape, and size) and in patterned arrangements (rows, etc.). Some graves have markers or surface contour patterns (mounds or depressions) indicating their location which provide other lines of evidence to confirm GPR results. This gives us a straightforward general principle for identifying unmarked graves: areas of difference in GPR results that are approximately the appropriate size, shape, location, and orientation of graves very likely are graves.
However, there is considerable interpretive value in exploring the specific associations between geophysics for the principles of EM wave propagation, dissipation, and reflection, subsurface patterns, and the characteristics of graves. Doing so generates more confidence in our interpretations and allows us to better identify graves in complex geological contexts. We refer to the specifics of a grave pattern, its geophysical effects, and the GPR result as a "trait". As noted in a recent paper (Martindale et al 2023), the published literature on this subject provides us with a range of such traits and a lot of variability. We identified 23 traits in the current literature but found that only one was noted in more than 50% of identified graves. This means that in different contexts, graves can appear with different patterns in GPR results. In this section, we identify the main traits that we have noted are associated with graves and describe their appearance in GPR results.
Many GPR interpretations rely on amplitude maps - plan view (from above) projections of reflective intensity patterns. These are usually presented in vertical sets, allowing inspection of the results at intervals of depth. Amplitude maps are useful, but should not be solely relied on. They are projected extrapolations from actual data, collected in grid lines. Each line of data is represented as a profile (side-view) called a radargram. Radargrams contain the most complete and representative GPR data. A good principle to follow is: if a pattern is visible in amplitude maps, check the radargrams to confirm its nature; check radargrams for patterns that are not clearly visible in amplitude maps, we know of examples where amplitude maps are inadequate and patterns are only visible in radargrams. The following trait list focuses largely on radargrams:
- Vertical stratigraphic discontinuities. As noted above, graves usually appear in GPR as areas of higher reflective difference against a less reflective matrix. The causes of this are 1) higher water content in the grave shaft, and 2) grave contents that increase reflection. As a result, graves can appear as areas of difference in radargrams. If the difference is consistent across neighboring radargrams, then the pattern will appear in amplitude maps. "Difference" here refers to any distinction, however graves usually are:
- Areas of higher intensity reflection because the have materials of different (usually higher) electrical permittivity; this appears as regions of brighter and more contrasted black/white band than surrounding regions.
- Patterns with abrupt vertical boundaries that define the vertical discontinuities caused by the grave shaft walls. Since graves walls extend to near the surface the difference between and within the grave is pronounced.
- Areas that have variation within them, such as point target hyperbolas
- Refractive hyperbolic shapes. Hyperbolic shapes in the GPR signal are commonly associated with point targets - small, spherical or circular objects of high reflection. The movement of the GPR array, its broadcast of a conical transmitting signal, and its plotting of return reflections directly below the array create this hyperbolic effect. However, a second form of similar shape can be created by two nearby parallel vertical discontinuities. In this configuration, which is also seen in utility service trenches, the GPR signal reflects off one vertical boundary and then the second creating a concentration of signal above the two. This "diffractive hyperbola" is flatter than point target hyperbolas and often lacks pronounced tails. These patterns usually appear above the area of greatest difference in electrical permittivity between the contents of the shaft and the surrounding sediment. Since this is often related to water content, the upper location of this can move seasonally and may be lower than the top of the actual grave or grave shaft. Some graves show two hyperbolas stacked, representing the upper water difference and a pattern from the lower floor and walls of the grave shaft.
- Internal shouldering. As noted above, grave shafts are often defined by vertical discontinuities. The internal (grave side) of these are sometimes distinguished by "shouldering" - half hyperbolic shapes that descend into the grave from the wall. These derive from the reflection of the refractive transition from surrounding sediment to grave shaft (and vice versa).
- Surface reflections. Graves often have surface patterns, mounds or depressions associated with the grave shaft. These can produce their own reflective signal near the ground surface. This is a region of the radargram that is often obscured by the air wave - the direct signal from the transmitting to receiving antenna - which can be filtered out with background subtraction. Surface reflections appear as basin shaped areas of high intensity and contrast, though they are typically shallow, only one or two black/white bands thick.
- Internal point targets. As noted above, the contents of graves can include objects that are small and highly reflective - creating point target hyperbolas. These are usually clustered at the base of the grave shaft and, given the depth, have weak hyperbolic tails.
- Void effects. Casket burials sometime contain voids - air spaces. These are regions with very high electrical permittivity differences between the void (air) and the sediment (high water content). As with diffractive hyperbolas, the reflection of the signal between the boundaries of the void can generate refractive effects. Voids often generate an X-shaped pattern above where the lower initiation of the lines marks the lower boundary of the void.
The following image, from Wadsworth et al (2020, Figure 5), illustrates several of the above traits. A selection of radargrams (left) from areas indicated in the amplitude map (right, radargram locations are the black lines) illustrate probable graves (1-4, +) and possible graves (dashed boxes, +), each with several of the above traits. Stratigraphic discontinuities are visible in all the potential graves, though they can be obscured by strong diffractive hyperbolas (in 1, 2, and 3). Weaker hyperbolas are visible in 4. The hyperbola in "+" is a point target hyperbola, note how it is narrower and defined by a smaller apex.

The following illustration from Conyers (2013:139, Figure 8-15) is a good example of a clear vertical stratigraphic discontinuity and a surface reflection from a depression (referred to as a slump). Note also that the contents of the grave at the lower depths produce complex reflections. Internal shouldering is also seen near the upper range of the grave shaft.

Voids are uncommon, in our experience. The illustration below, also from Conyers (2013:134, Figure 8-6), shows a burial with a diffractive hyperbola (right) and one with a void, characterized by intersecting reflected waves (air waves) within the air space of the casement. This pattern, like diffractive hyperbolas, emerge from interacting waves reflecting off boundaries between materials with very different electrical permittivity characteristics (like air/water).

There are other traits for graves in GPR, but these are the most common, in our experience. Remember that the geological variation of graves in GPR data is not fully accounted for, so trait frequencies and patterns may vary between regions and conditions. Evidence is emerging, but it seems that the above traits are likely to be found in temperate conditions with silt-gravel sediments for rectangular grave shafts. Further research need to be conducted to better resolve other conditions, including clandestine graves.
Confidence and Interpretation
Above, we have used the language of "probable", "possible" etc. when referring to graves identified in GPR. We currently advocate for the terms and logics presenting in the table below from Martindale et al (2023:11, Table 2). We expect that further work, especially regarding the defining and enumerating of traits, will refine this table. However, it has value as a general guide. Note that the GPR results focus on the three middle categories (unlikely, possible, and probable). Very low confidence indicates no GPR data and very high confidence requires an additional, non-GPR line of evidence.

References
Conyers, L. B. (2013). Ground-penetrating radar for archaeology geophysical methods for archaeology. AltaMira Press.
, , , , & (2023). The challenges of signal interpretation of burials in ground-penetrating radar. Archaeological Prospection, 31(4), 337–351. https://doi.org/10.1002/arp.1920
Wadsworth, W. T. D., Supernant, K., & Dersch, A. (2021). Integrating remote sensing and indigenous archaeology to locate unmarked graves. Advances in Archaeological Practice, 9(3), 1–13. https://doi.org/10.1017/aap.2021.9